"Characterization of the Circulation on the
Continental Shelf Areas of the Northern Chukchi
and Western Beaufort Seas"
Overview
This BOEM sponsored project (AK NSL 12-03) is studying the physical
oceanography of the NE Chukchi shelf and exchanges between the northeast Chukchi and the western Beaufort shelves and the adjacent basin. The results can be used to guide the development and evaluation of the oil spill trajectory models which will likely be used during future offshore oil development activities, and will provide insights on processes relevant to the functioning of this marine ecosystem.
As of 2016, this project is in its final stages. Field work has finished and the final report has been submitted. Journal articles are also under preparation.
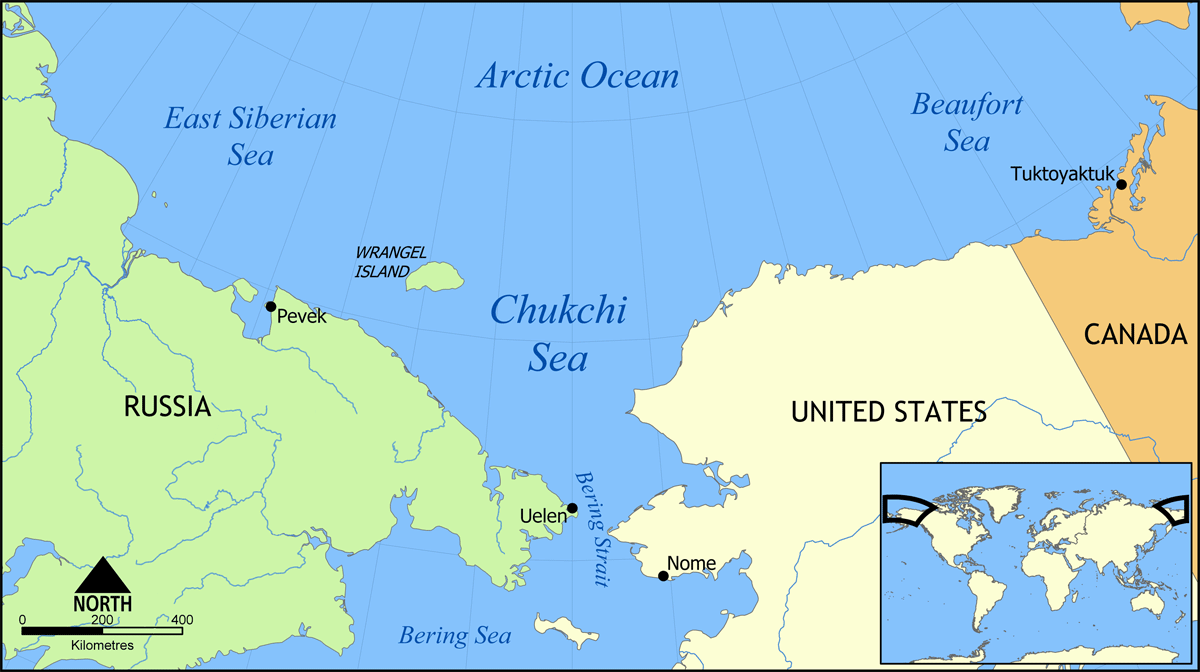
Map of the Chukchi Sea (Wikimedia Commons)
The Chukchi and Beaufort Seas are the northernmost shelves bordering Alaska. Although properly part of the western Arctic Ocean, they are atmospherically and oceanographically linked to the Pacific Ocean. The atmospheric link is primarily via the Aleutian Low. The oceanographic link is via the mean northward flow through Bering Strait, which is sustained by a large-scale pressure gradient between the Pacific and Atlantic oceans [Coachman et al., 1975; Aagaard et al., 2006].
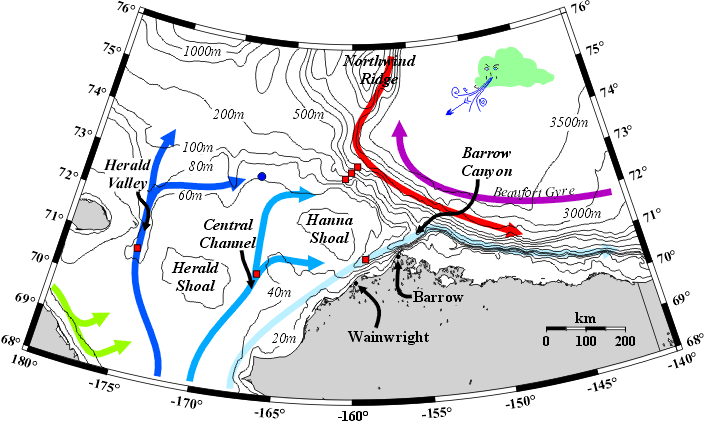
Map of circulation features in the Chukchi Sea and Western Beaufort Seas (click to enlarge)
Primary Pathways:
Although the mean flow is nominally northward over much of the shelf, the bulk of the transport proceeds along three principal pathways, with each pathway associated with a distinct bathymetric feature; Herald Valley, the Central Channel, and Barrow Canyon. The troughs are separated from one another by shoals: Herald Shoal separates Herald Valley from the Central Channel and Hanna Shoal lies between Barrow Canyon and the Central channel.
Objectives
In order to clarify specific aspects of this circulation, the objectives of our project are to:
(click to expand each for its background)
-
Verify model-predicted clockwise circulation around Hanna Shoal, and evaluate its strength, persistence, and variability;

Mean depth-integrated streamlines (white)in the Chukchi Sea, after Spall (2007).
(Click to enlarge)
Hanna Shoal
The schematic of Chukchi Sea circulation shows that a large portion of the water flushing through the central and western Chukchi Sea moves eastward north of Hanna Shoal. According to models [Winsor and Chapman, 2004; Spall, 2007], the shelf portion of this flow turns southward along the east side of Hanna Shoal and eventually enters the head of Barrow Canyon. Measurements from the Joint Industry Chukchi Sea Environmental Studies Program (CSESP) imply that this is the source of cold and dense bottom waters at the Burger survey site, creating different conditions there than at the Klondike survey site.
-
Estimate the mass transport contributions across the various shelf pathways that feed the transport in Barrow Canyon (including southwestward flow over the shelf from Hanna Shoal), and examine the flow of water into/out of Barrow Canyon and the shelf-basin exchange processes on either side of the canyon;
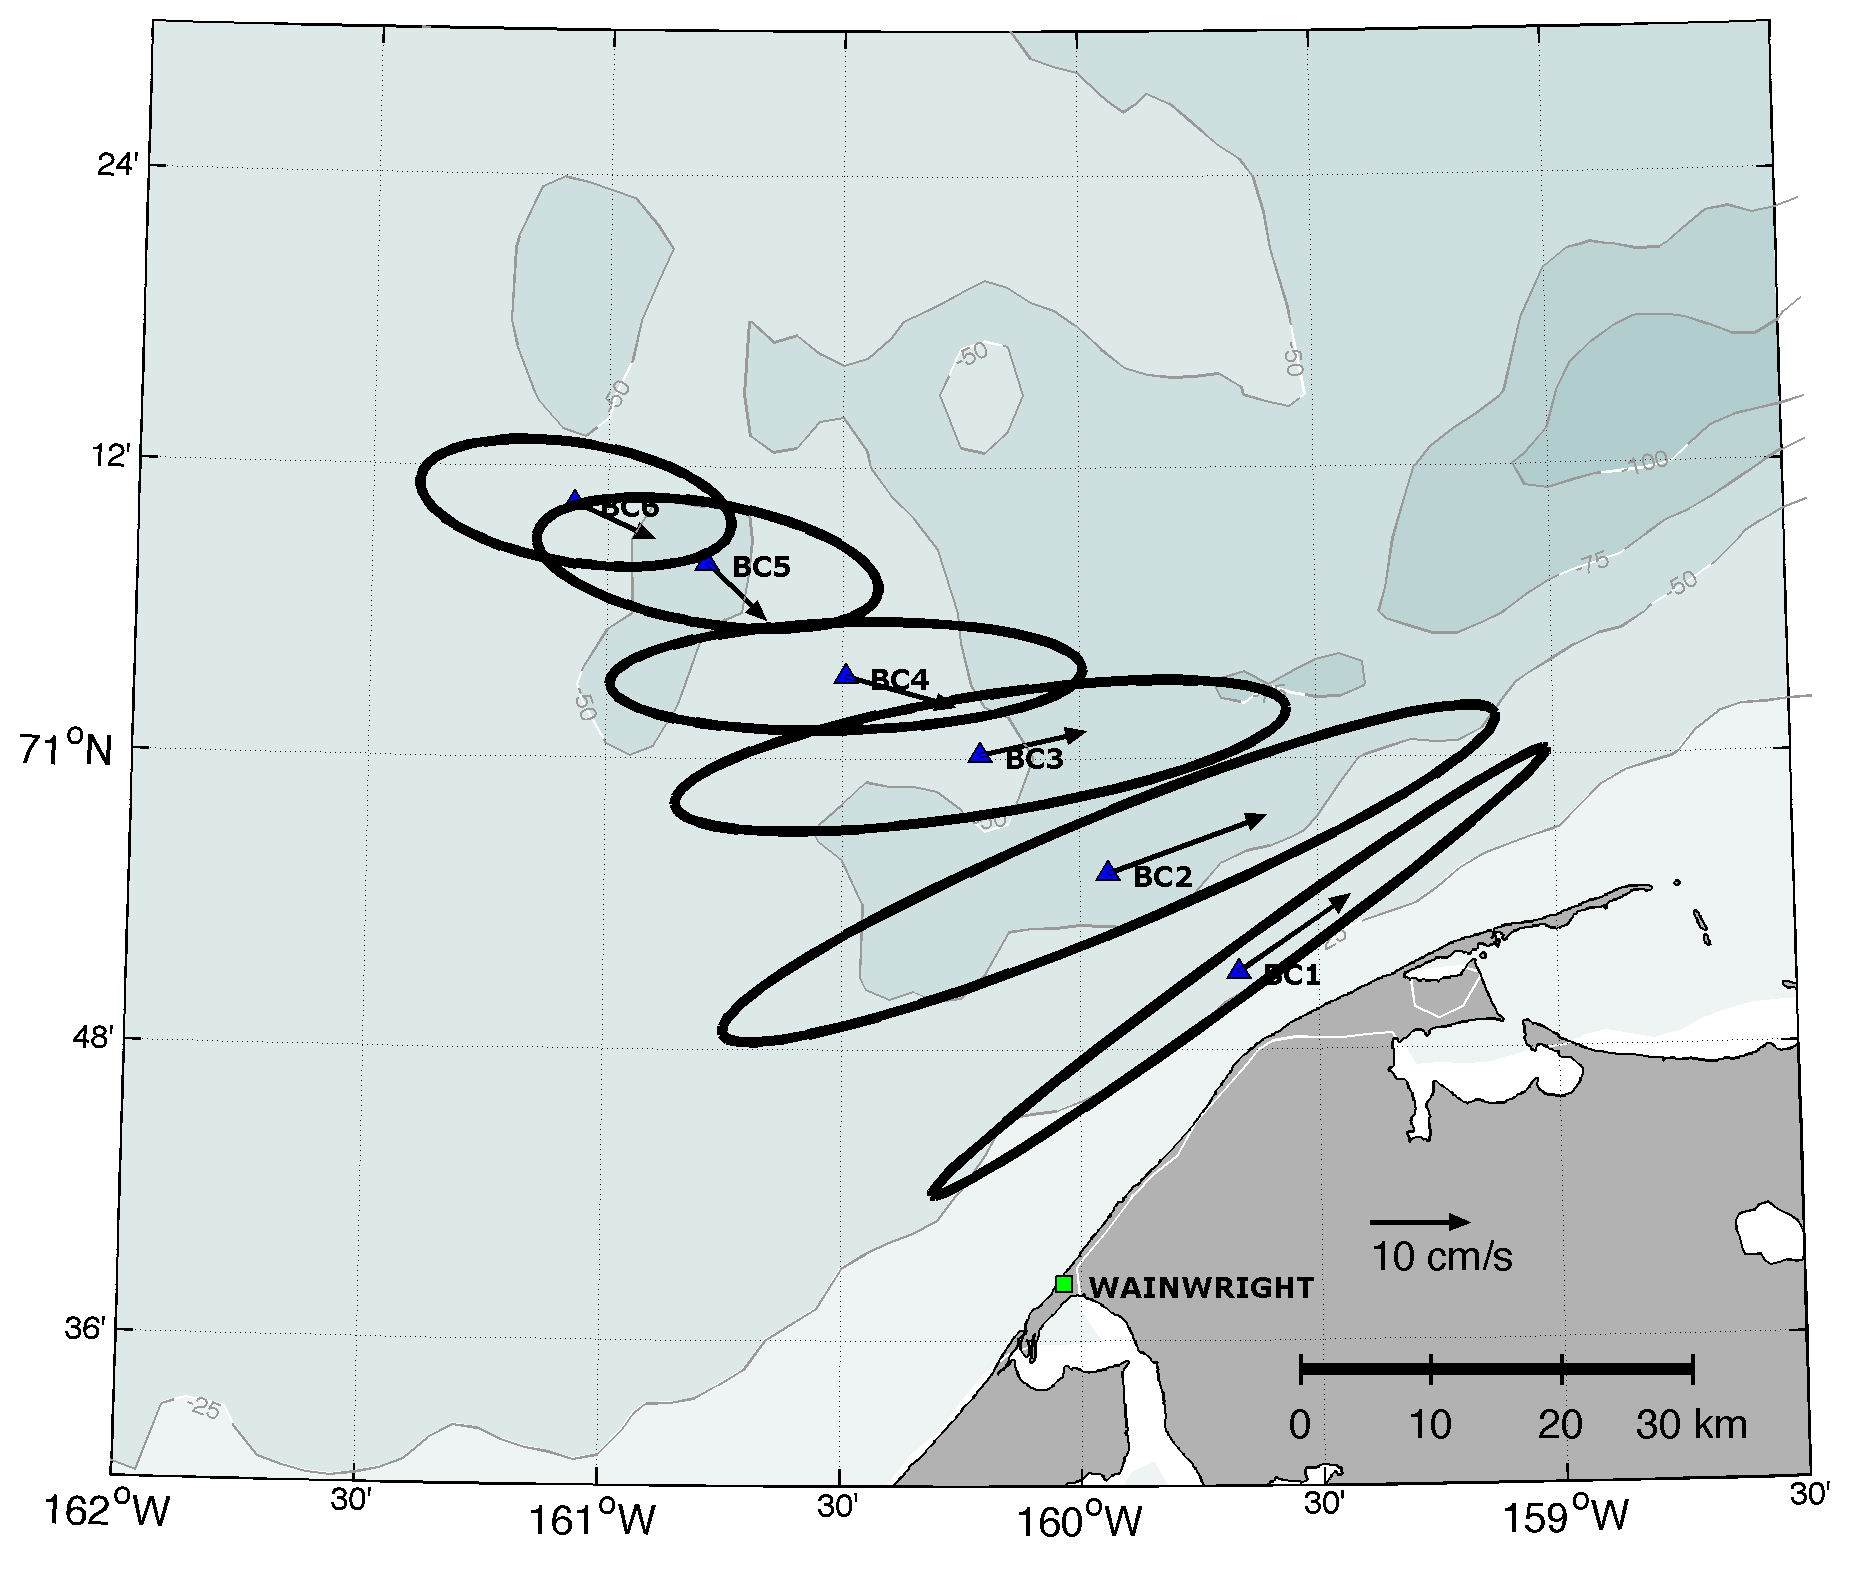
Vertically-averaged record-mean currents and current variance elipses from moorings, August 2010 - August 2011.
(Click to enlarge)
Barrow Canyon
The third branch of mean currents flows northeastward along the Alaskan coast towards Barrow Canyon at the junction of the Chukchi and Beaufort shelves [Mountain et al. 1976; Paquette and Bourke, 1981; Ahlnäes and Garrison, 1984]. In summer, this flow includes the northward extension of the Alaskan Coastal Current (ACC) that originates south of Bering Strait [Aagaard et al., 1985; Aagaard, 1988; Münchow et al. 2000]. At the head of Barrow Canyon, the ACC is joined by waters flowing eastward from the central shelf [Weingartner et al., 2005], and perhaps with water flowing southward from the east side of Hanna Shoal. The merged flow then continues downcanyon as a narrow, but strong, coastal jet[ Aagaard and Roach, 1990; Pickart et al., 2005]. We estimate that about 40% of the mean annual transport through Bering Strait enters Barrow Canyon, and from there to the basin and along the shelf-break. Because Barrow Canyon represents a major route between the survey areas and areas downstream, quantifying its transport is critical to understanding the entire area.
-
Construct local momentum balances, and, where and when possible, determine how the pressure field adjusts for given wind conditions and/or mesoscale flows;
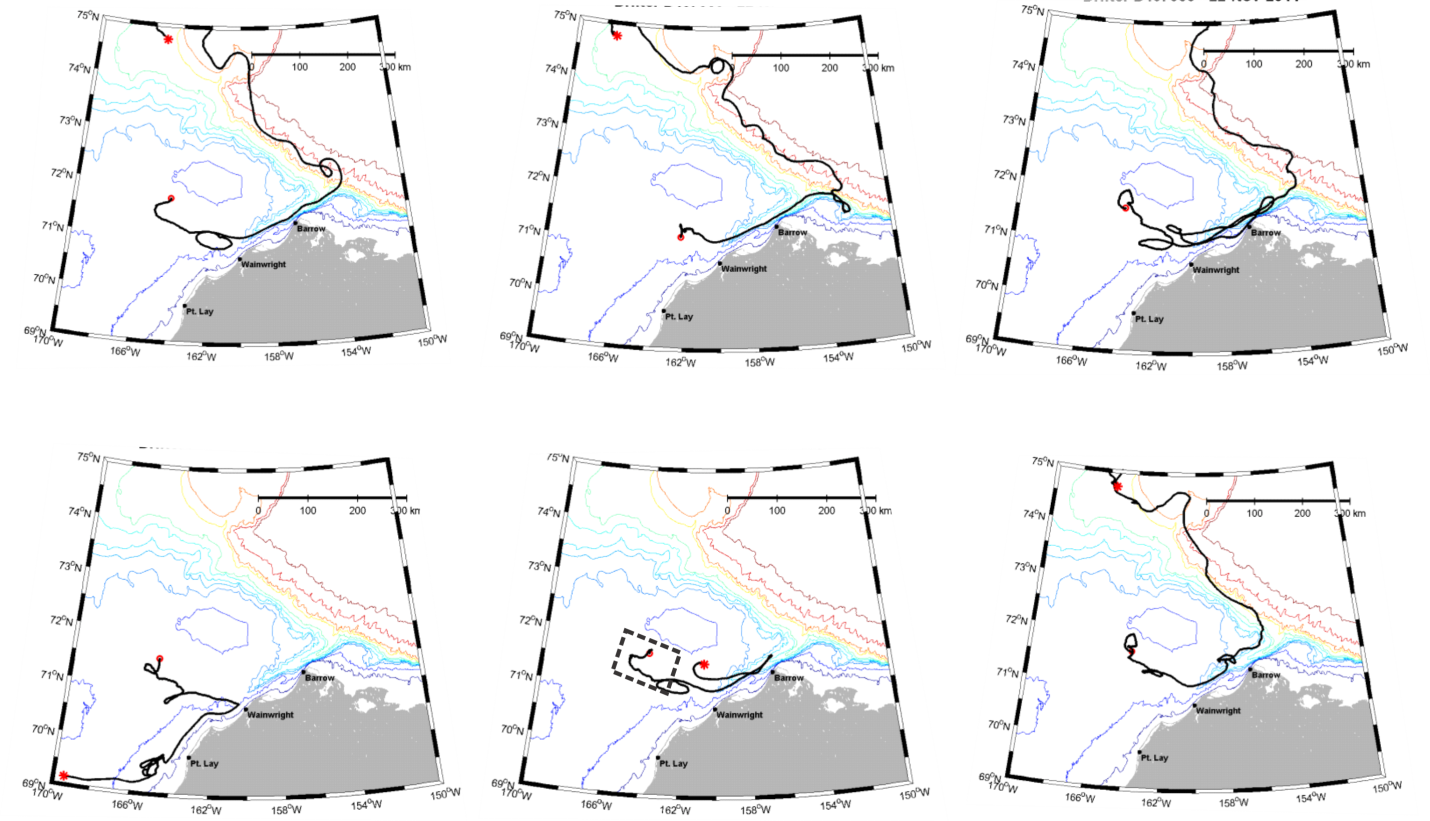
Trajectories of 6 satellite-tracked drifters released in the dashed box between August 12 to 17, 2011.
(Click to enlarge)
Momentum Balances
Oil spill dispersal models typically assume that the surface flow is “downwind”. However, the mean circulation on the Chukchi shelf, forced by the oceanographic pressure gradient between the Pacific and Arctic oceans, moves in opposition to the mean winds, which are from the northeast on average. Satellite-tracked drifter trajectories exemplify this; when the drifters were deployed, the mean winds were westward at ~3.5 m s-1, but the drifters moved “upwind”.

Time series of mean daily wind (Barrow) and along-canyon transport. Positive (negative) values of winds imply northeastward (southwestward) winds. Positive (negative) transports are northeastward (southwestward).
(Click to enlarge)
Another example is shown by wind and currents measured at a 2010 meteorological buoy in the Klondike survey area. Although current speeds vary with the wind, the mean flow over this period is northeastward at 3 cm s-1, whereas the mean winds are westward at ~4 m s-1. In fact, it appears that on only brief occasions, when westward wind speeds exceeded ~6 m s-1, do the surface currents reverse and flow downwind. This implies that there is a strong background geostrophic flow, which must be understood for proper prediction of oil spills. Using mooring and perhaps HFR data, we will calculate terms in the momentum balance equation such as wind stress forcing, water acceleration, Coriolis acceleration, and friction to see which processes are most important.
-
Determine vertical and horizontal coherencies in the currents, and determine the conditions, locations, and frequency under which, the surface (upper 1 m) circulation does/does not coincide with the sub-surface flow as measured by moored current meters;
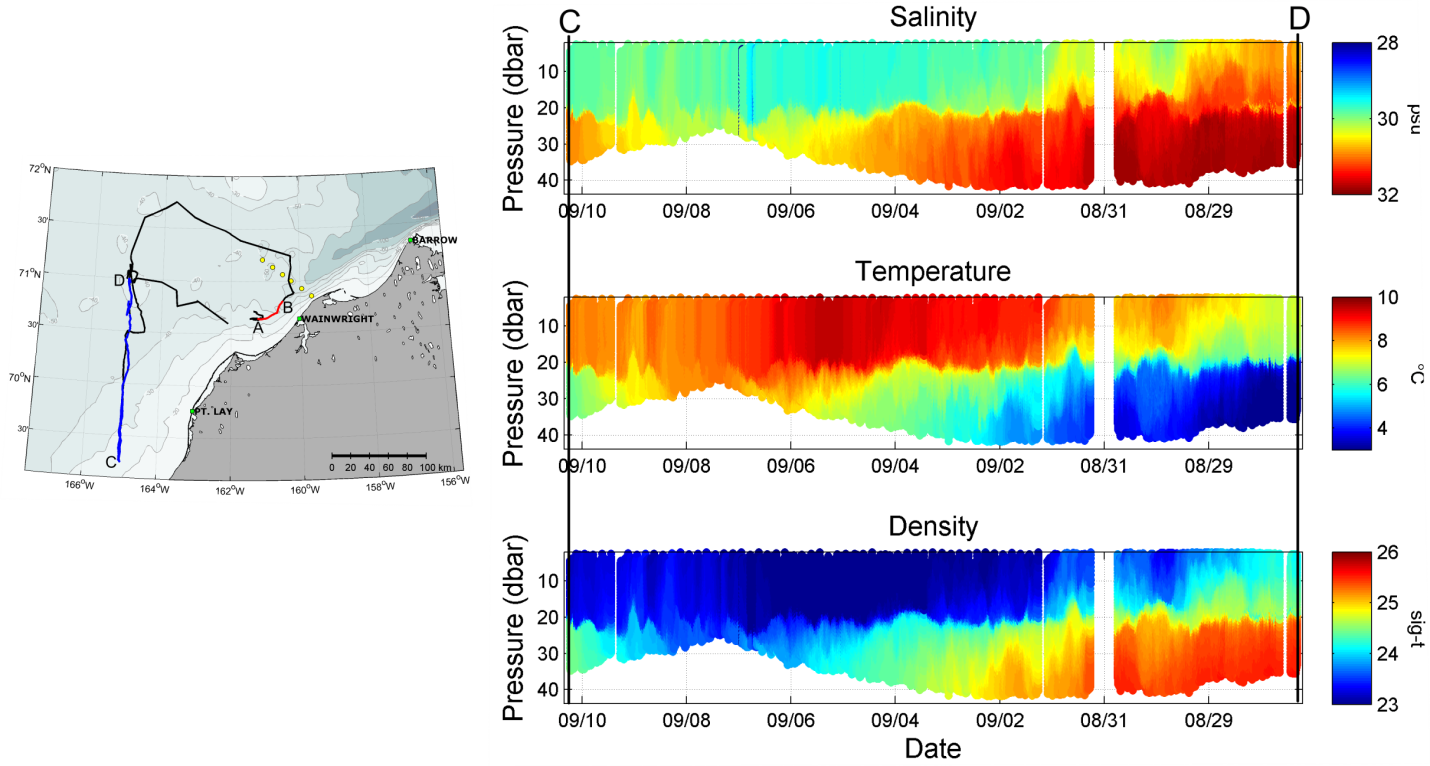
The distribution of salinity (top), temperature (middle), and density (bottom) from south to north along glider transect CD shown in the map to the left.
(Click to enlarge)
Coherence in Currents
Characterizing the spatial and temporal changes in stratification is important, since this can affect the surface velocity response to winds at similar time and space scales. Klondike is more weakly stratified and has little velocity shear compared to Burger. In part, this may be due to the heavier stratification over much of Burger, which often includes melt-water at the surface and dense water on the bottom. Hill [1996] argues that such dense pools rapidly spin-down, so that the sub-surface circulation within the dense pool stagnates and is effectively disconnected from the surface flow. Since the HFR system measures only surface flow, understanding when this is representative of the entire water column is useful.
-
Understand the conditions that govern, and the frequency of occurrence of, the along-shore and divergent current modes that occur in the Wainwright - Pt. Lay region;

Four-day averaged surface currents from September 13 – 16 (left) and Sept 17 – 20 (right) in 2010. The ellipses in the left hand panel show locations of data gaps due to land interference with the Point Lay and Wainwright radar signals.
(Click to enlarge)
Current Modes
Composites of 4-day averaged realizations from the HFR data collected in September 2010 suggest there are at least two coastal modes in the Chukchi shelf circulation under weak winds. The first mode is the continuous mode in which the along-shore flow is unidirectional along the coast and to the northeast (left panel). A second or divergent mode (right panel) includes cross-shelf flow, centered at ~71°N, 164°W and weakly eastward (and onshore). Upon reaching the coast, the flow diverges, resulting in southwestward flow offshore of Pt. Lay and strong northeastward flow into Barrow Canyon. The frequency of occurrence and causes of the divergent mode is unknown at present.
-
Quantify the shelf-basin exchange of heat, salt, momentum, and nitrate; determine the temporal variability in the shelf-basin exchange processes and isolate the causes of this variability in terms of local wind forcing, boundary current stability, and/or shelf wave phenomena.

AVHRR image of sea surface temperature from 20 July, 2009, showing the offshore movement of warmer water.
(Click to enlarge)
Shelf-basin Exchange
A large portion of the water progressing northward through the Chukchi Sea exits the shelf via Herald Valley in the west, and Barrow Canyon in the east, and subsequently forms shelf-break jets along the Chukchi and Beaufort shelves. However, the annually-averaged transport of the jet is a small portion of the annual mean transport of the Bering Strait inflow. This implies that most of the water reaching the shelf edge of the Chukchi/Beaufort Seas from Bering Strait is transferred to the basin quickly.
Shelf-to-basin transfer is governed by time-dependent mesoscale processes that occur on very small spatial scales. We believe that three mechanisms dominate: (1) instabilities of the canyon outflows and shelfbreak jet that lead to offshore-directed eddies, filaments, and lenses; (2) wind-forced exchange at the edge of the shelf and in the canyons; and (3) shelf-edge waves that propagate eastward in response to remote winds. Understanding these processes will lead to better understanding of shelf-basin exchange.
Instrumentation
The project’s three field years (2012-2014) will focus on site-specific measurements along the Chukchi and Beaufort shelf-breaks, around Hanna Shoal, and over the northeast Chukchi Sea including Barrow Canyon. A variety of instruments will measure the time-varying surface and sub-surface circulation and hydrography of the shelves and shelf-break. These instruments include:
- Shore-based, high-frequency, surface current mapping radar (HFR) installations;
- Autonomous underwater vehicles (gliders) which measure temperature, salinity, and occasionally biological variables in 3D space. These gliders can also infer water velocity;
- Satellite-tracked drifters to measure surface currents and sea surface temperature (SST);
- Year-round and short-term moorings;
- A towed, undulating CTD package that we will use to complete intensive, process-oriented surveys of temperature, salinity, chlorophyll fluorescence, backscatter, and CDOM.
Data collected by these instruments will be displayed, when possible, on a real-time map-based web tool. As the study progresses, data will be archived in local and national databases.
Supporting Documents
Reports
Presentations
In May 2016, our group made a presentation of our final report at the BOEM office, Anchorage, Alaska. Here are the slides from that presentation:
- Introduction (Weingartner)
- Retrospective of Shelfbreak/Slope (Pickart)
- HFR Observations (Fang)
- Quasi-Lagrangian Circulation (Weingartner)
- Hydrography (Winsor)
- Preliminary Synthesis (Weingartner)
Articles
This is where articles will be listed.